Hi Hugo
\[ \begin{aligned} y_i | d_i, \mu, \lambda &\sim \text{N}(\mu_{d_i}, 1 / \lambda_{d_i}), \\ P(d_i = k | w) &= w_k, \end{aligned} \]
library(ggplot2)
oplot <- ggplot(Orange, aes(x = age,
                   y = circumference,
                   colour = Tree)) +
  geom_point() +
  geom_line() +
  guides(colour = FALSE) +
  theme_bw()
oplot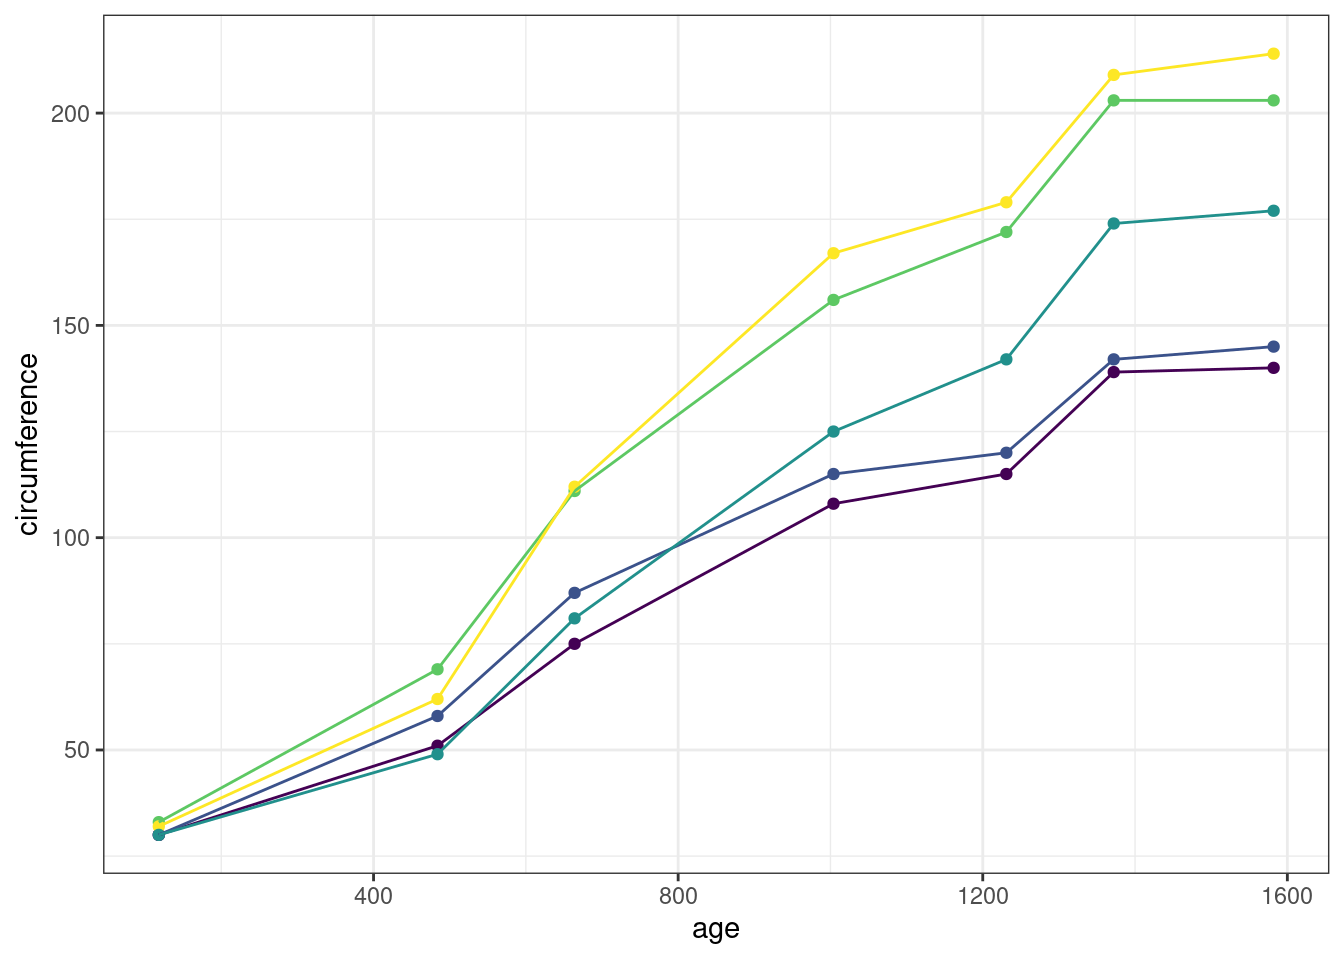
Iván Gutiérrez Martínez
PhD Student in Statistics
My interests include Bayesian statistics, imputation, and scientific computing.